Web Scraping Wunderground Weather History With Python - Celsius


This article is related to my other wunderground scraper article, and will explain how to use selenium driver in order to load the data directly in Celsius. If you are landing on this article, I suggest that you first check out the Wunderground Scraper article for better understanding.
Since by default Wunderground loads the data in Fahrenheit, we need to perform several clicks to instruct the page to load the data in Celsius. Please note that this loads the whole data in metric units. So the wind speed, pressure and precipitation will also be in metric units.
The initial function that would load the data in Fahrenheit looked like this:
    def render_page(url):
        driver = webdriver.Chrome('path_to/chromedriver')
        driver.get(url)
        time.sleep(3)
        r = driver.page_source
        driver.quit()
        return r
In order to do instruct the website to load data in Celsius, we need to slightly change the render function as shown below:
    def render_page(url):
        driver = webdriver.Chrome('path_to/chromedriver')
        driver.get(url)
        time.sleep(3)
        element = WebDriverWait(driver, 10).until(
            EC.presence_of_element_located((By.ID, 'wuSettings'))
        )
        element.click()
        element = WebDriverWait(driver, 10).until(
            EC.presence_of_element_located((By.XPATH, '//*[@id="wuSettings-quick"]/div/a[2]')))
        element.click()
        time.sleep(3)
        r = driver.page_source
        driver.quit()
        return r
What we are doing here is defining a clickable element by finding the button ID. Let's use the Lisboa weather history Wunderground page as an example. If you open this page and right-click, inspect the settings button in the top right corner you will see something like the below:
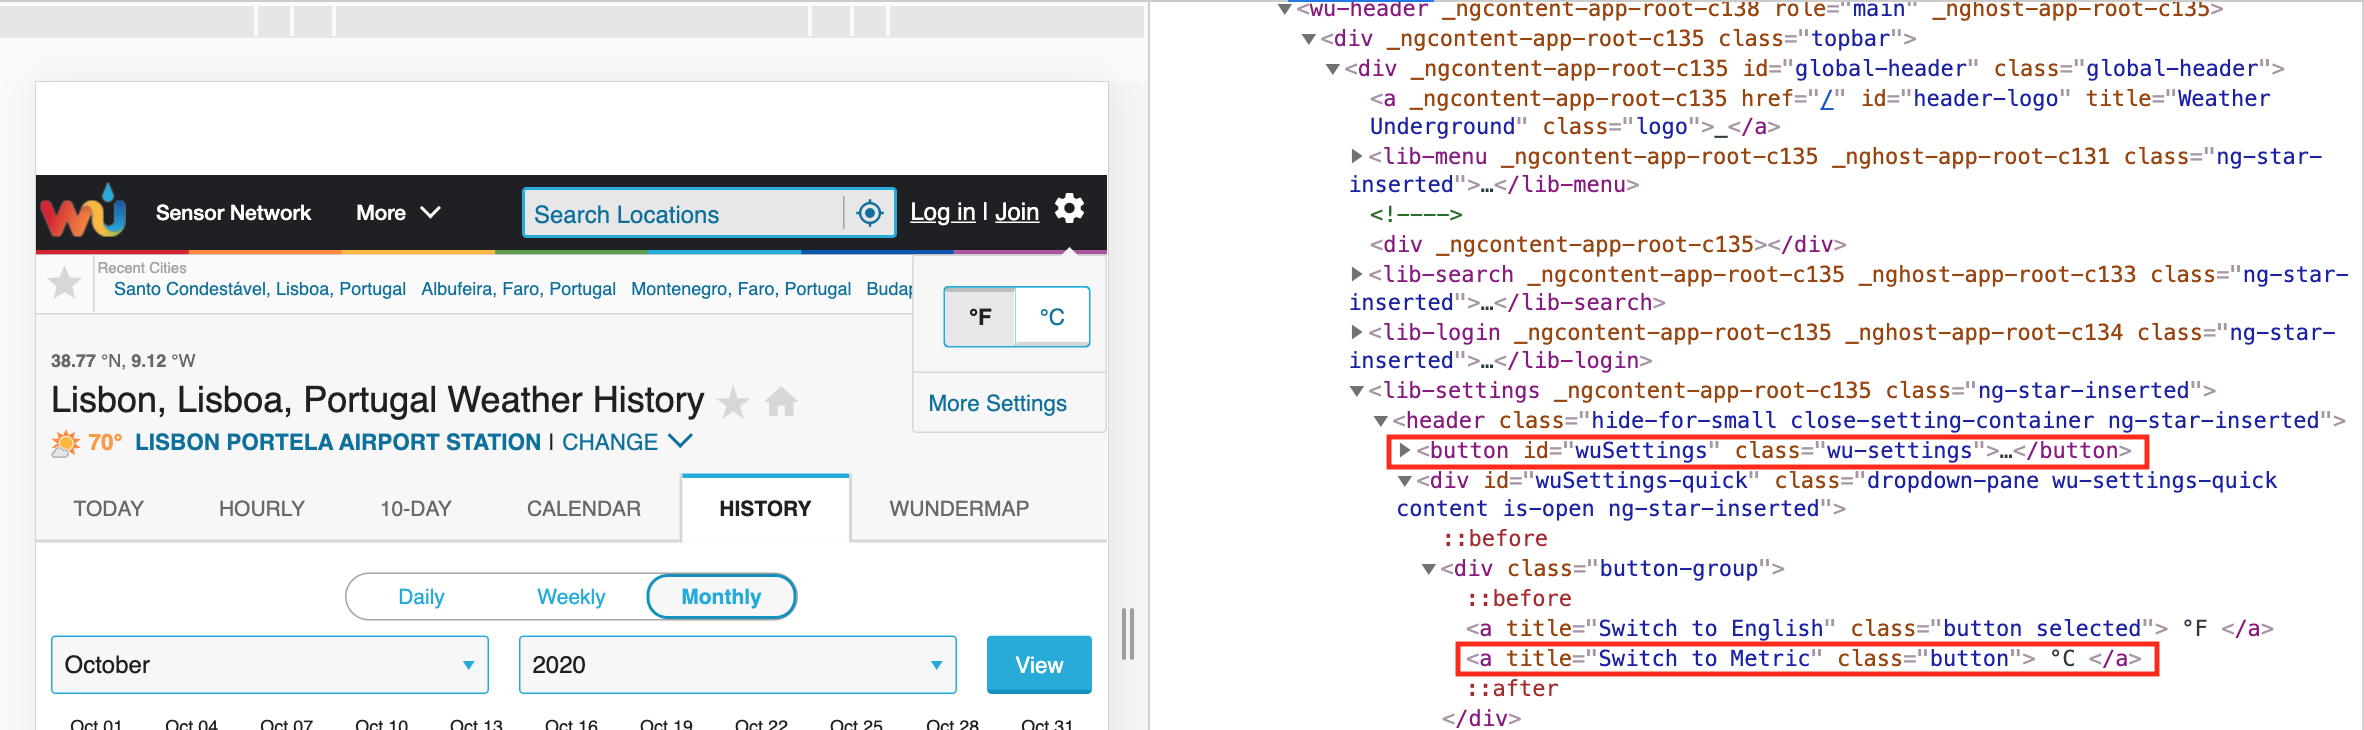
As you see the button ID that we want to first click is 'wuSettings' (the first highlighted rectangle). Therefore, we use this to define the first clickable element and click it. Once this opens, we have a second button in order to change the data to Celsius. If you see the inspect element section here (second rectangle), the two button options for Fahrenheit/Celsius are under a div tag, then each under a separate a tag. In this case we are looking for the second a tag, therefore its path being "//*[@id="wuSettings-quick"]/div/a[2]". With this we define a second clickable element and click it. We let the page load and we get the page resources.
Please note, that sometimes the pages load slower in which case you might need to increase the time.sleep(3) command from 3 to 5 or more if necessary. Now that the render function is updated, you can just replace the old one with this one, inlcude the remainder of the code (shown below) and your data will be extracted in metric units.
    def scraper(page,dates):
        output = pd.DataFrame()

        for d in dates:

            url = str(str(page)+str(d))

            r = render_page(url)

            soup = BS(r, "html.parser")
            container = soup.find('lib-city-history-observation')
            check = container.find('tbody')

            data=[]

            for c in check.find_all('tr',class_='ng-star-inserted'):
                for i in c.find_all('td',class_='ng-star-inserted'):
                    trial = i.text
                    trial = trial.strip('  ')
                    data.append(trial)

            if round(len(data)/17-1)==31:
                Temperature = pd.DataFrame([data[32:128][x:x+3] for x in range(0, len(data[32:128]),3)][1:],columns=['Temp_max','Temp_avg','Temp_min'])
                Dew_Point = pd.DataFrame([data[128:224][x:x+3] for x in range(0, len(data[128:224]),3)][1:],columns=['Dew_max','Dew_avg','Dew_min'])
                Humidity = pd.DataFrame([data[224:320][x:x+3] for x in range(0, len(data[224:320]),3)][1:],columns=['Hum_max','Hum_avg','Hum_min'])
                Wind = pd.DataFrame([data[320:416][x:x+3] for x in range(0, len(data[320:416]),3)][1:],columns=['Wind_max','Wind_avg','Wind_min'])
                Pressure = pd.DataFrame([data[416:512][x:x+3] for x in range(0, len(data[416:512]),3)][1:],columns=['Pres_max','Pres_avg','Pres_min'])
                Date = pd.DataFrame(data[:32][1:],columns=data[:1])
                Precipitation = pd.DataFrame(data[512:][1:],columns=['Precipitation'])
                print(str(str(d)+' finished!'))
            elif round(len(data)/17-1)==28:
                Temperature = pd.DataFrame([data[29:116][x:x+3] for x in range(0, len(data[29:116]),3)][1:],columns=['Temp_max','Temp_avg','Temp_min'])
                Dew_Point = pd.DataFrame([data[116:203][x:x+3] for x in range(0, len(data[116:203]),3)][1:],columns=['Dew_max','Dew_avg','Dew_min'])
                Humidity = pd.DataFrame([data[203:290][x:x+3] for x in range(0, len(data[203:290]),3)][1:],columns=['Hum_max','Hum_avg','Hum_min'])
                Wind = pd.DataFrame([data[290:377][x:x+3] for x in range(0, len(data[290:377]),3)][1:],columns=['Wind_max','Wind_avg','Wind_min'])
                Pressure = pd.DataFrame([data[377:464][x:x+3] for x in range(0, len(data[377:463]),3)][1:],columns=['Pres_max','Pres_avg','Pres_min'])
                Date = pd.DataFrame(data[:29][1:],columns=data[:1])
                Precipitation = pd.DataFrame(data[464:][1:],columns=['Precipitation'])
                print(str(str(d)+' finished!'))
            elif round(len(data)/17-1)==29:
                Temperature = pd.DataFrame([data[30:120][x:x+3] for x in range(0, len(data[30:120]),3)][1:],columns=['Temp_max','Temp_avg','Temp_min'])
                Dew_Point = pd.DataFrame([data[120:210][x:x+3] for x in range(0, len(data[120:210]),3)][1:],columns=['Dew_max','Dew_avg','Dew_min'])
                Humidity = pd.DataFrame([data[210:300][x:x+3] for x in range(0, len(data[210:300]),3)][1:],columns=['Hum_max','Hum_avg','Hum_min'])
                Wind = pd.DataFrame([data[300:390][x:x+3] for x in range(0, len(data[300:390]),3)][1:],columns=['Wind_max','Wind_avg','Wind_min'])
                Pressure = pd.DataFrame([data[390:480][x:x+3] for x in range(0, len(data[390:480]),3)][1:],columns=['Pres_max','Pres_avg','Pres_min'])
                Date = pd.DataFrame(data[:30][1:],columns=data[:1])
                Precipitation = pd.DataFrame(data[480:][1:],columns=['Precipitation'])
                print(str(str(d)+' finished!'))
            elif round(len(data)/17-1)==30:
                Temperature = pd.DataFrame([data[31:124][x:x+3] for x in range(0, len(data[31:124]),3)][1:],columns=['Temp_max','Temp_avg','Temp_min'])
                Dew_Point = pd.DataFrame([data[124:217][x:x+3] for x in range(0, len(data[124:217]),3)][1:],columns=['Dew_max','Dew_avg','Dew_min'])
                Humidity = pd.DataFrame([data[217:310][x:x+3] for x in range(0, len(data[217:310]),3)][1:],columns=['Hum_max','Hum_avg','Hum_min'])
                Wind = pd.DataFrame([data[310:403][x:x+3] for x in range(0, len(data[310:403]),3)][1:],columns=['Wind_max','Wind_avg','Wind_min'])
                Pressure = pd.DataFrame([data[403:496][x:x+3] for x in range(0, len(data[403:496]),3)][1:],columns=['Pres_max','Pres_avg','Pres_min'])
                Date = pd.DataFrame(data[:31][1:],columns=data[:1])
                Precipitation = pd.DataFrame(data[496:][1:],columns=['Precipitation'])
                print(str(str(d)+' finished!'))
            else:
                print('Data not in normal length')

            dfs = [Date, Temperature, Dew_Point, Humidity, Wind, Pressure, Precipitation]

            df_final =reduce(lambda left,right: pd.merge(left,right,left_index=True,right_index=True), dfs)

            df_final['Date'] = str(d) +"-"+ df_final.iloc[:,:1].astype(str)

            output = output.append(df_final)

        print('Scraper done!')

        output = output[['Temp_avg', 'Temp_min', 'Dew_max', 'Dew_avg', 'Dew_min', 'Hum_max',
                            'Hum_avg', 'Hum_min', 'Wind_max', 'Wind_avg', 'Wind_min', 'Pres_max',
                            'Pres_avg', 'Pres_min', 'Precipitation', 'Date']]

        return output


    dates = ['2020-5','2020-4','2020-3']
    page = 'https://www.wunderground.com/history/monthly/pt/lisbon/LPPT/date/'

    df_output = scraper(page,dates)
I have also put together a .py file including the scraping function from before, and it's available for download below.
Download FileAnother important thing to note is that this makes the scraper run slower, in case you are scraping data over many years it might be better to perform the conversions on your own. Therefore, the second option is to extract the data as in the original article in Fahrenheit and later apply this code to transform it to metric units.
    # First we need to convert the dataframe to numeric type
    # Select all the columns except Date
    cols = df.columns.drop('Date')
    # Convert all columns except date to numeric
    df[cols] = df[cols].apply(pd.to_numeric)

    # select columns to apply the Fahrenheit to Celsius formula to
    cols_convert = df.columns[0:6]
    # apply formula to those columns
    df[cols_convert] = df[cols_convert].apply(lambda x: (x-32)*5/9)

    # select columns to apply the mph to kmh formula to
    cols_convert = df.columns[9:12]
    # apply formula to those columns
    df[cols_convert] = df[cols_convert].apply(lambda x: x*1.60934)

    # select columns to apply the Hg to milibar formula to
    cols_convert = df.columns[12:15]
    # apply formula to those columns
    df[cols_convert] = df[cols_convert].apply(lambda x: x*33.8639)

    # select columns to apply the in to mm formula to
    cols_convert = df.columns[15:16]
    # apply formula to those columns
    df[cols_convert] = df[cols_convert].apply(lambda x: x*25.4)
I hope this has helped you, please contact me below in case you have any questions or improvements.