Web Scraping Wunderground Weather History With Python - Fahrenheit


Web scraping is the process of loading, fetching and extracting data from a website. Fetching refers to downloading of the contents, which also happens when you browse and open pages on the internet. Once the page has been fetched, then we can process and extract data from it. The html content is parsed and can later be used to find the specific details of that page that we want to take out. This can ultimately be exported as a csv, excel if necessary, or it can directly be used for analysis. Web scraping sites can be tricky business, but it doesn't have to be as difficult as it sounds. It is a fun little task and there are several ways to do it. This article will show python scraping weather history.
Often people are interested in obtaining historical weather data in order to use it in their analysis or just have a record of it. One website that offers this is wunderground.com. The easiest way to obtain their historical weather data is using their API for which you need to pay. Another option (the option that I will show in this article) is to scrape it using several libraries in Python. Please note that the data that we will extract here is in Fahrenheit. In case you want to convert it to Celsius you can use the following formula: (1°F − 32) × 5/9 = -17.22°C. If you follow this link, I have put up another article showing how to do this.
Before we start, you need to make sure to install the following libraries in your python environment:
    pip install beautifulsoup4
    pip install selenium
The other libraries that will be used are more standard and most people would already have them installed in their environment. Another thing that needs to be installed for this process is ChromeDriver. You can find the instructions on installing it on the following link. Download it, install it and place it in a folder that is easily accessible to you. Once you have made sure that the above requirements are satisfied we can start with building the code in python.
First, we import all the necessary libraries:
    from bs4 import BeautifulSoup as BS
    from selenium import webdriver
    from functools import reduce
    import pandas as pd
    import time
Then we will create and run two functions that would help us extract the data from the table at the bottom of the historical wunderground page, which is also shown in the image below:
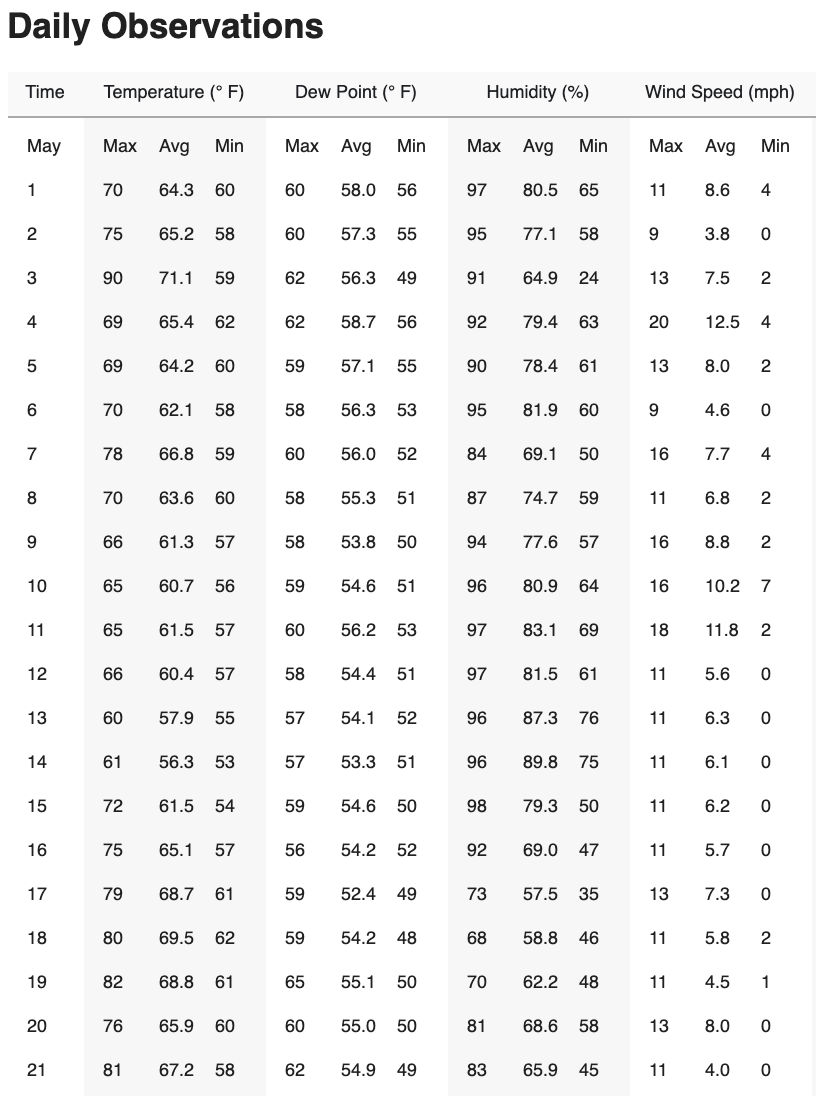
I will present the code section by section so I can explain what each section is meant for. The full function is available in the bottom of this page.
The first function that we define is the render_page function. This is necessary because Wunderground has its own protection, and if you load the page without chromedriver and parse it, it will return no records to show. To see why, try loading the page on your browser and pay attention to how the page is loading its data. First you will see the "No data recorded" for a few seconds then the content we want will load.

This is where we will use webdriver from selenium library and chromedriver in order to let the content fully load, after which we can parse it. In the function below, the only thing that you need to change is to set the correct path to where you have saved your chromedriver. Quickly going through the function, (1) we make selenium run our chromedriver which opens a chrome window (make sure to replace path_to with the path to where your chromedriver is saved) (2) we tell the driver to load the specified page, (3) we set time to let the page fully load (otherwise we again get "No data recorded"), (4) we get the page resources and (5) quit the driver.
    def render_page(url):
        driver = webdriver.Chrome('path_to/chromedriver')
        driver.get(url)
        time.sleep(3)
        r = driver.page_source
        driver.quit()
        return r
This function will be called within the next function that we will define. The next function, which we'll call scraper will use the render page function to load the data, and ultimately scrape the information we want.
The function needs only two arguments, the first one is the page that we want to scrape. For this it is important to understand the structure of wundergound's url. I will use Lisbon, Portugal as an example since I am currently living here. The page for the month of May 2020 is: https://www.wunderground.com/history/monthly/pt/lisbon/LPPT/date/2020-5. What needs to be inputted in the page argument is the url up until the date ( https://www.wunderground.com/history/monthly/pt/lisbon/LPPT/date/). To understand this better we need to look at the second argument in the functions. In the dates argument we will input a date or a list of dates in the following format (yyyy-m). The function will loop through all the dates we want and load the full url's for all the listed dates.
(1) Within the function we first create an empty dataframe which will later be appended once we have arranged our data correctly. (2) we loop through all the dates passed in the arguments (3) we put the function arguments together for loading the url. (4) we call the render page function to load the url. (5) We then call the BeautifulSoup library to parse the html content of the page. (6) We find the specific div's in the html code and extract the content from it. This stores all the content in a list. (7) From the list we then extract a separate dataframe for Date, Temperature, Dew_Point, Humidity, Wind, Pressure and Precipitation depending on its length, which is related to the length of each month. (8) we create a list of the dataframes from step (7). (9) Then we merge all these dataframes into one final one. (10) Creating a proper date column. (11) We append the empty dataframe created in step (1). All of these steps are looped through and repeated for each date inputted in the date argument in the function.
    def scraper(page, dates):
        output = pd.DataFrame()

        for d in dates:

            url = str(str(page) + str(d))

            r = render_page(url)

            soup = BS(r, "html.parser")
            container = soup.find('lib-city-history-observation')
            check = container.find('tbody')

            data = []

            for c in check.find_all('tr', class_='ng-star-inserted'):
                for i in c.find_all('td', class_='ng-star-inserted'):
                    trial = i.text
                    trial = trial.strip('  ')
                    data.append(trial)

            if round(len(data) / 17 - 1) == 31:
                Temperature = pd.DataFrame([data[32:128][x:x + 3] for x in range(0, len(data[32:128]), 3)][1:],
                                           columns=['Temp_max', 'Temp_avg', 'Temp_min'])
                Dew_Point = pd.DataFrame([data[128:224][x:x + 3] for x in range(0, len(data[128:224]), 3)][1:],
                                         columns=['Dew_max', 'Dew_avg', 'Dew_min'])
                Humidity = pd.DataFrame([data[224:320][x:x + 3] for x in range(0, len(data[224:320]), 3)][1:],
                                        columns=['Hum_max', 'Hum_avg', 'Hum_min'])
                Wind = pd.DataFrame([data[320:416][x:x + 3] for x in range(0, len(data[320:416]), 3)][1:],
                                    columns=['Wind_max', 'Wind_avg', 'Wind_min'])
                Pressure = pd.DataFrame([data[416:512][x:x + 3] for x in range(0, len(data[416:512]), 3)][1:],
                                        columns=['Pres_max', 'Pres_avg', 'Pres_min'])
                Date = pd.DataFrame(data[:32][1:], columns=data[:1])
                Precipitation = pd.DataFrame(data[512:][1:], columns=['Precipitation'])
                print(str(str(d) + ' finished!'))
            elif round(len(data) / 17 - 1) == 28:
                Temperature = pd.DataFrame([data[29:116][x:x + 3] for x in range(0, len(data[29:116]), 3)][1:],
                                           columns=['Temp_max', 'Temp_avg', 'Temp_min'])
                Dew_Point = pd.DataFrame([data[116:203][x:x + 3] for x in range(0, len(data[116:203]), 3)][1:],
                                         columns=['Dew_max', 'Dew_avg', 'Dew_min'])
                Humidity = pd.DataFrame([data[203:290][x:x + 3] for x in range(0, len(data[203:290]), 3)][1:],
                                        columns=['Hum_max', 'Hum_avg', 'Hum_min'])
                Wind = pd.DataFrame([data[290:377][x:x + 3] for x in range(0, len(data[290:377]), 3)][1:],
                                    columns=['Wind_max', 'Wind_avg', 'Wind_min'])
                Pressure = pd.DataFrame([data[377:464][x:x + 3] for x in range(0, len(data[377:463]), 3)][1:],
                                        columns=['Pres_max', 'Pres_avg', 'Pres_min'])
                Date = pd.DataFrame(data[:29][1:], columns=data[:1])
                Precipitation = pd.DataFrame(data[464:][1:], columns=['Precipitation'])
                print(str(str(d) + ' finished!'))
            elif round(len(data) / 17 - 1) == 29:
                Temperature = pd.DataFrame([data[30:120][x:x + 3] for x in range(0, len(data[30:120]), 3)][1:],
                                           columns=['Temp_max', 'Temp_avg', 'Temp_min'])
                Dew_Point = pd.DataFrame([data[120:210][x:x + 3] for x in range(0, len(data[120:210]), 3)][1:],
                                         columns=['Dew_max', 'Dew_avg', 'Dew_min'])
                Humidity = pd.DataFrame([data[210:300][x:x + 3] for x in range(0, len(data[210:300]), 3)][1:],
                                        columns=['Hum_max', 'Hum_avg', 'Hum_min'])
                Wind = pd.DataFrame([data[300:390][x:x + 3] for x in range(0, len(data[300:390]), 3)][1:],
                                    columns=['Wind_max', 'Wind_avg', 'Wind_min'])
                Pressure = pd.DataFrame([data[390:480][x:x + 3] for x in range(0, len(data[390:480]), 3)][1:],
                                        columns=['Pres_max', 'Pres_avg', 'Pres_min'])
                Date = pd.DataFrame(data[:30][1:], columns=data[:1])
                Precipitation = pd.DataFrame(data[480:][1:], columns=['Precipitation'])
                print(str(str(d) + ' finished!'))
            elif round(len(data) / 17 - 1) == 30:
                Temperature = pd.DataFrame([data[31:124][x:x + 3] for x in range(0, len(data[31:124]), 3)][1:],
                                           columns=['Temp_max', 'Temp_avg', 'Temp_min'])
                Dew_Point = pd.DataFrame([data[124:217][x:x + 3] for x in range(0, len(data[124:217]), 3)][1:],
                                         columns=['Dew_max', 'Dew_avg', 'Dew_min'])
                Humidity = pd.DataFrame([data[217:310][x:x + 3] for x in range(0, len(data[217:310]), 3)][1:],
                                        columns=['Hum_max', 'Hum_avg', 'Hum_min'])
                Wind = pd.DataFrame([data[310:403][x:x + 3] for x in range(0, len(data[310:403]), 3)][1:],
                                    columns=['Wind_max', 'Wind_avg', 'Wind_min'])
                Pressure = pd.DataFrame([data[403:496][x:x + 3] for x in range(0, len(data[403:496]), 3)][1:],
                                        columns=['Pres_max', 'Pres_avg', 'Pres_min'])
                Date = pd.DataFrame(data[:31][1:], columns=data[:1])
                Precipitation = pd.DataFrame(data[496:][1:], columns=['Precipitation'])
                print(str(str(d) + ' finished!'))
            else:
                print('Data not in normal length')

            dfs = [Date, Temperature, Dew_Point, Humidity, Wind, Pressure, Precipitation]

            df_final = reduce(lambda left, right: pd.merge(left, right, left_index=True, right_index=True), dfs)

            df_final['Date'] = str(d) + "-" + df_final.iloc[:, :1].astype(str)

            output = output.append(df_final)

        print('Scraper done!')

        output = output[['Temp_avg', 'Temp_min', 'Dew_max', 'Dew_avg', 'Dew_min', 'Hum_max',
                         'Hum_avg', 'Hum_min', 'Wind_max', 'Wind_avg', 'Wind_min', 'Pres_max',
                         'Pres_avg', 'Pres_min', 'Precipitation', 'Date']]

        return output
Once we have both of these functions run, all we need to do is create a list of dates we want, define the page we want and run the scraper with those inputs as shown below:
    dates = ['2019-4','2019-5']
    page = 'https://www.wunderground.com/history/monthly/pt/lisbon/LPPT/date/'
    df_output = scraper(page,dates)
This outputs a dataframe (df_output). The dataframe is fully operational and has all the months that we have scraped.
To download a .py file click on the link below. In order to run it, you need to make sure you have all the libraries installed, and replace the chromedriver path with your own.
Download FileI hope this has helped you, please contact me below in case you have any questions or improvements.